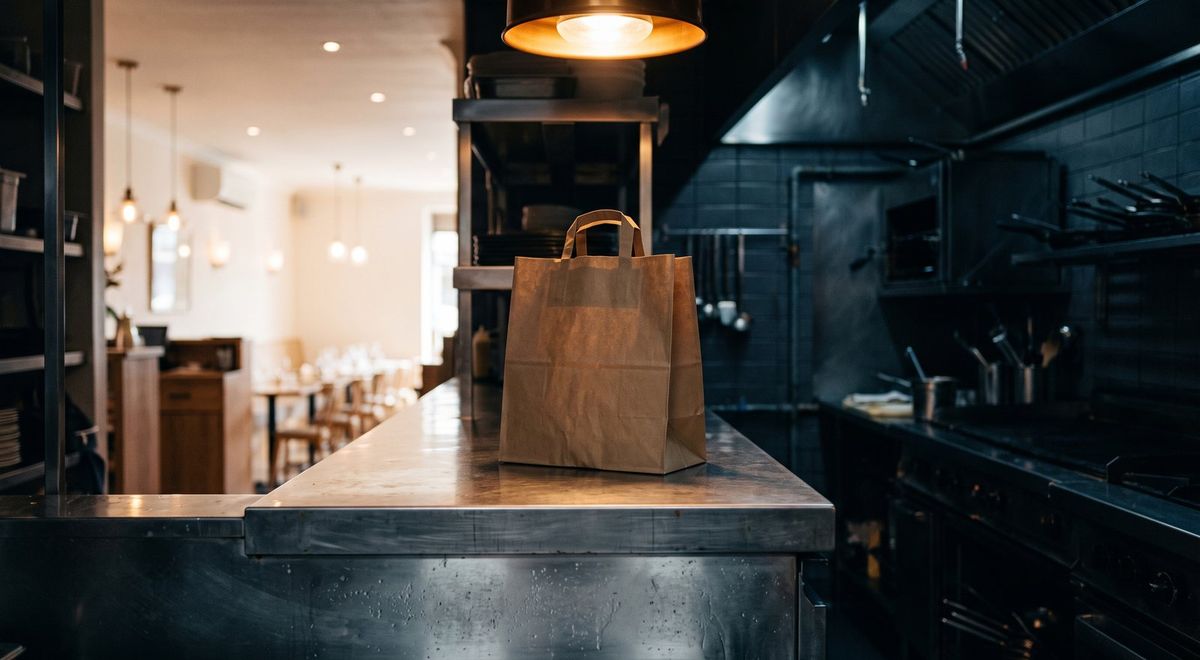
How Restaurant Websites Hand Orders to the Delivery Apps
Every slow restaurant website is writing a commission check to DoorDash.
That is not a metaphor. It is a mechanics problem. A hungry customer on their phone opens your website, waits, waits a little longer, and makes the only logical decision available to them: they open an app that loads instantly, finds your restaurant listed there, and places the same order you could have taken directly. You get the revenue. The platform takes 15 to 30 percent off the top.
The customer was yours. The speed gap gave them away.
The Platform Advantage You Are Competing Against
DoorDash, Uber Eats, and their peers are not in the restaurant business. They are in the conversion business. Their engineering teams measure performance in milliseconds and optimize relentlessly, because every fraction of a second of delay costs them an order. They have solved mobile loading at scale in a way that almost no independent restaurant website has.
The result shows up in the data. Aggregate ecommerce research by Attribute and Monetate, covering Q4 2024 across a large sample of ecommerce platform transactions, found that the food and beverage category has the smallest mobile-to-desktop conversion gap of any ecommerce category: 3.1% on mobile versus 4.8% on desktop (Attribute / Monetate Q4 2024 + Adobe Analytics 2025). That gap of roughly one-third is unusually tight compared to other categories. The reason is urgency: hungry people push through friction that would stop a casual shopper.
But here is the critical caveat the data carries. That 3.1% mobile figure includes the major delivery platforms themselves, which have heavily optimized mobile experiences. A standalone restaurant website without dedicated performance engineering almost certainly converts below 3.1% on mobile. The figure describes the ceiling for the food and beverage category, a ceiling that your site probably has not reached because the platforms have raised it on their side of the ledger.
The gap between what your direct-order page converts and what DoorDash converts is the mechanism that moves margin out of your pocket.
The Commission Arithmetic
Walk through the numbers at a realistic scale.
Assume a restaurant processing 200 direct online orders per month at an average ticket of $45. That is $9,000 in monthly direct revenue, orders where you keep the full margin.
Now assume that slow load times on mobile push 30 of those potential direct orders to a delivery platform charging 25% commission. That commission rate is illustrative; the actual market range is roughly 15 to 30%, and most full-service partnerships sit toward the higher end. On 30 orders at $45, the commission is $337.50 per month.
Annualized: $4,050 in commission paid on orders that could have been direct, not because a customer chose the platform for its selection or convenience, but because your website made them wait and the app did not.
The $4,050 is not a speed optimization cost-benefit calculation. It is the cost of not having done the optimization.
Where the Exit Happens
Contentsquare’s 2025 Digital Experience Benchmarks, based on 90 billion sessions across 6,000 global websites, found that 53% of visitors to slow-loading pages exit after viewing only one page. For a restaurant site, that single page is usually the home page or the landing page from a search result.
A visitor who bounces from that page has not decided they are not hungry. They have decided your website is not the easiest path to food. Where bounce rate jumps sharply, the pattern is consistent: diners abandon faster than almost any other visitor type, because the alternative, an app that loads instantly, is already on their phone.
The same urgency dynamic shows up in booking-oriented businesses. The same mechanics that explain why patients leave before they book a dental appointment apply here: a visitor who arrived with high intent and a clear action in mind hits a slow page and makes a cost-of-effort calculation. The decision to close the tab takes less than a second. Getting that visitor back costs you a marketing budget.
The exit is silent in your analytics. There is no entry reading “sent to DoorDash.” There is only a bounce, which looks identical to a bounce from someone who opened the wrong link.
LCP: Largest Contentful Paint, is the metric that measures how long it takes for the biggest visible element on your page to appear on screen. It is the closest technical measure of what a user experiences as “the page loaded.” Google classifies LCP under 2.5 seconds as Good, 2.5 to 4.0 seconds as Needs Improvement, and over 4.0 seconds as Poor. Most restaurant websites have never been measured against this threshold.
The Local Search Connection
Restaurant discovery happens on mobile, and mobile discovery happens through local search. According to a 2025 meta-analysis by Ranktracker, 46% of all Google searches have local intent, with approximately 1.5 billion “near me” searches occurring monthly. “Restaurants near me” is among the highest-volume local intent queries on the internet.
That traffic arrives at your site, not your delivery-platform listing, if you are capturing it. But capturing near-me intent depends on what happens after the click. A customer searching “Thai food near me” at 6:30 on a Friday evening is not researching. They are deciding. The site that answers fastest earns the order.
Core Web Vitals: Google’s published performance standards for real-user loading, interactivity, and layout stability, function as a gate in Google’s ranking system. Sites that fail Core Web Vitals thresholds are not penalized with a score reduction; they lose a ranking protection that passing sites hold. On a competitive local search result page where several restaurants appear, the site that meets Core Web Vitals thresholds has protected its position. The one that fails them has not.
The implication: your organic local ranking and your direct-order conversion are connected by the same underlying fix.
The Objection Worth Addressing
“We are already on DoorDash. The commission is a cost of doing business.”
That framing makes sense if the alternative to a platform order is no order. It makes less sense if the alternative is a direct order at the same ticket price, because the economics of those two outcomes are very different.
A direct $45 order at 70% food margin nets you roughly $31.50. A platform $45 order at 70% food margin minus 25% commission nets you roughly $20.25. The difference is $11.25 per order.
At 30 recaptured orders per month, the margin recaptured is $337.50, the same $4,050 annually from the earlier arithmetic, now expressed as margin rather than commission. Neither calculation assumes you increase your total order volume. Both assume only that you close the speed gap that is making the direct-order channel lose to the platform on mobile.
This is not a question of being on or off a delivery platform. It is a question of whether your own site is fast enough to compete for the direct-order version of customers who are already looking for you.
What Staff Phones Are Not Telling You
The most consistent error in self-assessment here is testing on the wrong device. Your staff’s phones are not your customer’s phones. Staff devices are typically newer, connected to the restaurant’s WiFi, and cached from daily use. A first-time customer arriving from a search result is on a mid-range Android on a mobile network, uncached, and competing for bandwidth.
INP: Interaction to Next Paint, measures how quickly your page responds when a visitor taps something: a menu button, an order form, a reservation link. Google classifies INP responses over 200 milliseconds as needing improvement, and over 500 milliseconds as poor. A menu that feels instantaneous on your cached work phone may be taking 400 milliseconds to respond on an uncached mid-range device. That 400-millisecond hesitation is enough to create doubt, and hungry customers with an app already installed do not need much doubt.
The gap between how your site feels to you and how it performs for first-time mobile visitors is exactly the gap delivery platforms exploit.
The Free Assessment
iServU’s free assessment pulls the real-user performance data for your website: LCP, INP, and CLS (Cumulative Layout Shift, which measures unexpected page movement during loading), from Google’s own field measurements. It maps that data against Google’s published thresholds and against the direct-order commission arithmetic at your actual order volume and average ticket.
The output is not a score. It is a monthly number: what the current speed gap is likely costing in margin routed to delivery platforms, stated as a range, with the assumptions made transparent.
Gabriel Lopez-Seco runs it directly. No account manager. No handoff.
If your direct-order channel is underperforming your platform volume, the speed gap is the first place to look.
Schedule a free assessment at iServU.
Sources
- Attribute / Monetate Q4 2024 + Adobe Analytics 2025 (2025). Mobile vs. Desktop Checkout Data, food and beverage category CVR (3.1% mobile, 4.8% desktop). https://www.getattribute.com/blog/mobile-vs-desktop-checkout-2025-data
- Contentsquare (2025). 2025 Digital Experience Benchmarks: 90 billion sessions, 6,000 global websites. https://contentsquare.com/press/2025-digital-experience-benchmarks/
- Ranktracker (2025). Local SEO Statistics 2025: 46% local intent, 1.5 billion near-me searches/month. https://www.ranktracker.com/blog/local-seo-statistics-2025/

